STRESS - STRAIN CURVE FOR BRITTLE MATERIALS BASIC INFORMATION
What Is The Stress-Strain Curve Of Brittle Materials?
Many of characteristics of a material can be deduced from tensile test. It is more convenient to compare materials in terms of stresse and strain, rather than loads and extensions of a particular specimen of a material.
The stress at any stage is the ratio of the load of the original cross-sectional of area of the test specimen; the strain is the elongation of a unit length of the test specimen.
For stresses up to about 750 MN/m2 the stress-strain curve is linear, Showing that the material obeys Hooke’s law in this range, the material is also elastic in this range, and no permanent extension remains after removal of the stresses.
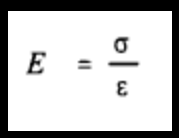
The ratio of stress to strain for this linear region is usually about 200 GN/m2 for steel; this ratio is known as Young’s modulus and that is denoted by E. The strain at limit of proportionality is of order 0.003, and is small compared with strains of the order 0.100 at fracture.
Stress-Strain Curve
We note that Young’s modulus has the units of a stress, the value of E define the constant in linear relation between stress and strain in elastic range of material. We have
 |
Stress-Strain Curve Of Brittle Materials |
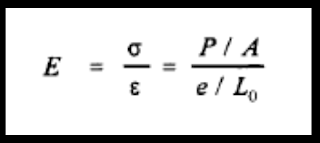
for the linear-elastic range. If P is total tensile load in a bar, A its cross-sectional area, and Lo its length, then
 |
| Stress-Strain Curve |
where e is extension of length Lo. Thus the expansions is given by
 |
| Stress-Strain Curve |
Stress-Strain Curve
If the material is stressed beyond linear-elastic range of the limit of proportionality is exceeded, and the strain increase non-linearly with the stress. Moreover, removal of stress leaves the material with some permanent extension; h range is then both non-linear and inelastic.
The maximum stresses attained may be of order of 1500 MNlm, and the total extension or elongation, at this stage may be of order of 10%. The curve of Figure 1.5 is typical of behaviour of brittle materials as for example, area characterized by small permanent elongation at the breaking point, in the case of metals this is usually Lo%, or less.
When a material is stressed beyond limit of proportionality and is then unloaded permanent deformations of the material take place. Suppose tensile test-specimen of Figure 1.5 is stressed beyond the limit of proportionality, to a point b on the stress-strain diagram. If the stress is now remove, the stress-strain relation follow the curve bc, when the stress is completely remove there is a residual strain given by intercept Oc on the &-axis.
If stress is applied again, the stress-strain relation follow the curve CD initially, and finally curve df to the breaking point. Both the unloading curve bc and reloading curve cd are approximately parallel to the elastic line Oa, they are curved slightly in the opposite directions.
hooke 's law - https://kdlearners.blogspot.com/2019/10/hookes-law.html
 |
| Stress-Strain Curve |
Stress-Strain Curve
The process of unloading and reloading, bcd, had little or no effect on stress at breaking point, the stress-strain curve the being interrupted by only a small amount bd, Figure 1.6. The strains -stresses curve of brittle material for tension and the compression are usually similar in form, : although the stress at the limit of proportionality and at fracture may be very different for two loading condition.
Typical tensile and the compressive stress-strain curve for concrete are shown in Figure 1.7; the maximum stress attainable in the tension is only about one-tenth of that in the compression, although the slope of the stress-strain curve in the region of zero stress are nearly equal.
Related post - https://kdlearners.blogspot.com/2019/10/hookes-law.html


0 comments:
Post a Comment